
Merafe Resources Limited
INTEGRATED ANNUAL REPORT
2025
Delivering today. Investing in tomorrow.
Natural capital includes the natural resources and processes needed by the organisation to produce its products. This section of the report covers the following areas:
This includes renewable (timber and water) and non-renewable (fossil fuels, minerals and metals) resources and processes such as energy consumption, waste creation, emissions, etc. Without access to the natural capital contained in our Mineral Resources and Reserves, our business would not exist.
“Our ambition is to be a leader in environmental performance, and to minimise harm to the environment, through environmental stewardship and responsible resource management across our global operations.”
See the online 2025 Integrated Annual Report for the full Environmental policy of Glencore and the Venture, which is also on our website on compliance, policies, charters and assurance.

 Natural capital focus areas
The CO2e generated per tonne of ferrochrome produced was
+5.39tCO2e and *6.16tCO2e
(2024: +5.6tCO2e and *5.8tCO2e)
The energy use per tonne of ferrochrome produced was
16.49GJ
(2024: 15.05GJ)
| * | Location. |
| * | Market-based. |
The Venture stakeholders benefit from its energy efficiencies, which have made it one of the lowest-cost ferrochrome producers in the world and one of the low-cost producers in South Africa.
The Venture focuses on understanding the current and future impact of climate change on its operations. Climate change risks are included in each operation’s risk assessment. It measures and interprets energy and GHG data to identify areas of opportunity. The Venture continuously researches and identifies potential energy and GHG reduction opportunities and evaluates the feasibility of implementing these opportunities. It also actively participates in discussions on climate change legislation via various industry organisations.
The Venture’s efforts to continually evaluate and improve its energy efficiency are in line with the societal demand to reduce the emissions of GHGs.
The Venture uses the Greenhouse Gas Protocol as an accounting and reporting standard for our emissions. The Venture has updated its Global Warning Potentials (GWPs) baseline to accord with the IPCC’s 6th Assessment Report (AR6). In 2022, the Venture embarked on a process to improve emission reporting with respect to our scope 2 emissions. In this regard, scope 2 emissions are now reported based on market and location. This enables the Venture to show the impact of renewable energy generation and purchases on our scope 2 emissions as the Venture may decarbonise faster than the country’s grid. Previously, the Venture only reported location-based emissions. This protocol was developed in partnership with the World Resources Institute and the World Business Council for Sustainable Development. It divides GHG emissions into different types, categorising them as either direct (scope 1) or indirect (scope 2) emissions.
Location-based scope 2 is GHG emission based on average energy generation emission factors for defined locations, including local sub-national or national boundaries (using mostly grid-average emission factors).
Market-based scope 2 is based on GHG emissions emitted by the generators from which the asset contractually purchases electricity bundled with instruments or unbundled instruments on their own, and for which a specific emission factor is known.
For 2025, the location-based emission factor obtained from the IEA was 876.5gCO2e/kWh. The market-based emission factor was 1.080gCO2e/kWh.
A representative of the Venture served on the council of the Energy Intensive User Group during 2025. The Venture, which participates in the Minerals Council of South Africa and the Ferro Alloys Producers Association environmental forum, represents the ferroalloys industry at Business Unity South Africa. The Venture’s representatives play a leading role in these forums and comment on climate change and carbon tax legislation.
The Venture also engages with government via these forums to ensure that the potential impact the proposed legislation will have on our industry and Company is understood.
During 2025, the Venture again played an important role in the engagement process between business and the Department of Fisheries, Forestry and the Environment (DFFE), DMPR and National Treasury on matters relating to GHG emissions, carbon tax, just transition and renewable energy generation.
Climate change performance is included in the health, safety, environment and community performance indicators that the Venture uses as part of its performance appraisals.
We are working with global specialists and draw on local expertise within our operational teams to identify value-accretive abatement opportunities to further reduce our carbon footprint.
The Glencore Alloys Group Environmental Manager is responsible for climate change-related issues in the Venture. The Venture has further created a new division responsible for decarbonisation with additional resources to enable it to meet its statutory obligations.

The renewable energy strategy to support 50% total CO2 emission reduction by 2035 (as set out above) is reliant on five pillars.
Integrated heat and gas from operations to produce electricity
Utilise available short-term NPA initiatives
Optimise processes to be as energy-efficient as possible
Long-duration energy storage
The Venture generates GHG emissions from its smelting processes and its energy use. The use of fossil fuels in the form of reductants in the furnaces contributes directly, and the electricity supplied from coal-fired power stations indirectly, to the creation of GHGs. The Venture and Merafe are committed to minimising GHG emissions and improving our energy efficiency, and recognise the magnitude and importance of this challenge. The Venture also actively engages in public policy, specifically through collaboration with the DFFE on a carbon process aimed at estimating the country’s annual carbon emissions.
Climate change remains a key longer-term risk for the Venture. The potential risks are complex in that they include operational risks such as business continuity, health and safety, environmental aspects and regulatory aspects. Risks are both physical and financial. For example, should the Venture’s operations be damaged by flooding and extreme storms, this could cause business interruptions. The reduced availability of water could also interrupt business operations and have health impacts.
Restatements of prior-year data occur due to improvements in testing and/or methodology. Unless mentioned otherwise, any restatement of prior-year data set out in this report is not significant or material.
Total energy consumption in the Venture’s operations decreased in 2025 due to reduced production. The energy consumption and performance of the Company in any year are dependent on the production performance and the contribution of the most energy-efficient plants in the Venture to that production.
The Venture’s energy usage(GJ)
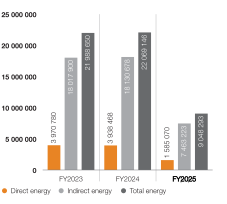
Total energy use per tonne of ferrochrome produced (GJ/tonnes)

The Venture has updated its GWPs baseline to accord with the IPCC’s 6th Assessment Report (AR6). The Venture’s total scope 1 (direct) and scope 2 (indirect) emissions decreased in 2025 due to limited operation duration driven by market conditions. The CO2e generated per tonne of ferrochrome produced during the year also reduced. The Company’s emissions performance depends on the production performance and contribution of energy-efficient plants during the year.
| GHG emissions (tCO2e) | Location based |
Market based |
||
| Scope 1 | 3 999 688 | 3 999 688 | ||
| Scope 2 | 6 014 144 | 6 738 620 | ||
| 2022 | Total | 10 013 832 | 10 738 308 | |
| Scope 1 | 3 239 639 | 3 239 639 | ||
| Scope 2 | 4 503 662 | 5 059 058 | ||
| 2023 | Total | 7 743 301 | 8 298 697 | |
| Scope 1 | 3 179 163 | 3 179 163 | ||
| Scope 2 | 4 987 077 | 5 330 545 | ||
| 2024 | Total | 8 166 240 | 8 509 708 | |
| Scope 1 | 1 140 162 | 1 140 162 | ||
| Scope 2 | 1 815 602 | 2 237 137 | ||
| 2025 | Total | 2 955 764 | 3 377 299 |
The Venture’s total scope 3 emissions in 2025 was 8 581 925 (tCO2e). See our online 2025 Integrated Annual Report for the scope 3 table, which provides the Venture’s data from 2022 to 2025 for scope 3 emissions in respect of category 1 (goods and services), category 2 (capital goods), category 3 (fuel and energy-related activities), category 4 (transportation and distribution), category 9 (transportation and distribution of sold products) and category 10 (processing of sold products). The table is also on our website on compliance, policies, charters and assurance.
Total CO2e generated per tonne of ferrochrome produced (tCO2e/tonne)

Environment includes the natural resources and processes needed by an organisation to generate its products.
Natural capital environment focus areasThis section of our report focuses on the Venture’s environmental approach, impact and performance. We rely on the Venture’s effective environmental policies and procedures to ensure our investment is managed responsibly.
The Venture’s total water reduced in 2025
Water conservation plans are in place at alloperations of the Venture
The Venture’s long-term success depends on prioritising environmental issues and integrating environmental responsibility into its strategic planning, management systems and day-to-day operations.
Management accountability is central to Glencore’s integrated approach, which reviews its environmental risks and opportunities annually as part of its business strategy and planning process. Each site has a comprehensive environmental management system in place. The system provides access to aspects and the impact of all activities, from pre-feasibility to the operational phase, including closure and rehabilitation. The Venture’s objective is to ensure environmental legal compliance, optimise its monitoring and measurement practices and minimise and manage any waste and emission generation in an environmentally responsible manner. Environmental responsibilities are clearly included in legal appointments and job descriptions.
Water is a finite and precious natural resource essential to the sustainability of the communities in which the Venture operates. It is also necessary for its mining and metallurgical processes.
The Venture’s operations are regulated through its Water Use Licences. One of the key legal compliance requirements is the development and annual updates of the operations’ Integrated Water and Waste Management Plan. The plans are underpinned by principles of responsible and sustainable water usage and pollution prevention. Various water treatment technologies, including bioremediation, have been implemented across the Venture’s operations. The initiatives do not only mitigate water pollution but also enable the re-use of process water and reduces reliance on municipal potable water. The recent heat wave and interruption of electricity supply prompted operations to review their water risk assessments, focusing on water availability and associated corrective measures. Based on the requirements of the Venture’s HSEC and HR Strategic overview, the assets have set catchment context-based local targets. The implementation of the enabling actions to achieve the targets will include local partnerships with other companies to improve the water quality in the catchment.
The Venture’s operations work with stakeholders to ensure the sustainability of water resources and equitable access to water resources for stakeholders.
We recognise access to safe and clean water and sanitation as salient human rights. We seek to fully understand and minimise our operational water footprint and manage our activities in a way that protects our shared water resources. We are committed to ensuring good water management is in place at all of our assets and undertake detailed assessments, monitoring and implementation of corrective actions. Our assets consult their host communities and other relevant local water users to understand local priorities and to collaborate on sustainable solutions.
The availability of water is a key consideration when the Venture plans the expansion or construction of an operation. It uses the results of the environmental and social impact assessments it undertakes to guide its decision making and to ensure it has the least possible impact on local water resources during the various phases of its projects.
All of the Venture’s operations have water conservation plans. They have previously set water intensity targets and have measures in place to help them be as water-efficient as possible. In addition, its operations are identifying possible water reduction projects.
The Venture’s water usage decreased in 2025 due to a decrease in production.
The Venture’s water usage (MI)*
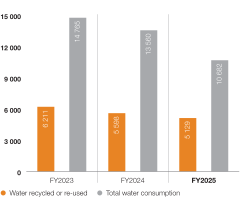
* Recycled or re-used water is included in the total water consumption data above.
The mineral waste produced by the Venture in 2025 is described below:
Aligned with legislation, our trained employees conduct internal management of waste streams where appropriate. The Venture treats and disposes of waste responsibly and re-uses and recycles waste where practicable. We continuously raise employee awareness with waste reduction and sorting with our multi-coloured refuse bin system.
| Category | 2025 tonnes |
2024 tonnes |
2023 tonnes |
|
| Mineral waste produced | 1 046 550 | 3 993 245 | 3 948 129 | |
| Non-mineral waste – disposed | 2 589 | 10 871 | 8 261 | |
| Non-mineral waste – recycled | 3 681 | 6 039 | 6 051 |
Biodiversity remains a key longer-term risk for the Venture. Biodiversity management for the Venture focuses on shifting toward the Task Force on Nature-related Financial Disclosure (TNFD) requirements. TNFD is a risk management and disclosure framework. The Venture has concluded its LEAP (Locate, Evaluate, Assess and Prepare) assessment. This process entails assessing the business footprint, where our direct assets and operations are; assessing the nature interface, priority location identification and the corresponding risks to the Venture; evaluating dependencies and impacts; and preparing to respond and report in line with the TNFD disclosure recommendations. The Venture is also modernising biodiversity surveys with eDNA sampling and analysis. Environmental DNA (eDNA) is traces of DNA that animals leave behind in the environment, particularly water. The first ever eDNA sample for the Venture was taken at the Boshoek smelter.

The Venture strives to have no environmental incidents across its operations. It monitors, reports, investigates and remediates any incidents that occur and applies lessons learnt to prevent similar incidents in the future. Its operations are required to report any environmental high-potential risk incidents, including near-misses, which could result in a category 4 or 5 incident, even when the actual impact was less significant. Environmental incidents recorded at the Venture’s operations also include incidents that occur as a result of contractor activity.
| Category | 2025 | 2024 | 2023 | 2022 | |
| Category 1 – negligible (causing negligible, reversible environmental impact, requiring very minor or no remediation) | 33 | 75 | 78 | 59 | |
| Category 2 – minor (causing minor, reversible environmental impact, requiring minor remediation) | 20 | 18 | 17 | 12 | |
| Category 3 – significant (causing moderate, reversible environmental impact with short-term effect, requiring significant remediation) | – | – | – | 1 | |
| Category 4 – major (causing serious environmental impact, with medium-term effect, requiring significant remediation) | – | – | – | – | |
| Category 5 – disastrous (causing disastrous environmental impact, with long-term effect, requiring major remediation) | – | – | – | – |
Note: The Venture received no environmental fines at its operations in 2025. There were no category 3, 4 and 5 incidents in 2025.
Category |
2025 tonnes |
2024 tonnes |
2023 tonnes |
2022 tonnes |
|
| NOx (oxides of nitrogen) | |||||
| Stack emissions (total mass) | 447 | 3 060 | 3 616 | 2 143 | |
| SOx (oxides of sulphur) | |||||
| Stack emissions (total mass) | 300 | 1 772 | 3 035 | 4 764 | |
| Total particulates | |||||
| Stack emissions (total mass) | 179 | 451 | 2 445 | 1 860 |
The decrease in emissions in 2025 is due to a significant reduction in production volumes.
The emission data is based on quarterly emission data, which is used to calculate emission factors and then applied to the year.
The nature of the operations at the Venture’s semi-closed furnaces means that diluted air enters the air pollution control equipment. NOx is formed as a secondary emission through the air pollution control equipment due to the presence of nitrogen in the air. Small process changes in terms of gas volume and temperature can result in step changes in NOx emissions. The emissions at the Venture comply with Atmospheric Emissions License Limits.
The Venture monitors and addresses the impacts and risks associated with the use of its products throughout their life cycles, including during stages outside of its control, such as use, recovery, recycling and disposal.
It works with national and international industry associations, its customers and suppliers to understand the environmental health and safety risks of its products and to find ways to mitigate these risks.
No products created by the Venture, or their packaging materials, were reclaimed during 2025.
To ensure the quality of its products, the Venture aligns its systems with the requirements of ISO 9001:2015 and some of its smelters are certified. Its laboratories are ISO 17025 accredited, which ensures that the methods and equipment it uses are accurate.
For further information on land use, see the Mineral Resources and Mineral Reserves statement in Appendix 1 .
Merafe’s attributable portion of the quantitative data of the Venture set out in manufactured, natural, human and social capital sections of this report is 20.5%.
The purpose of this report is to document an abridged version of the Mineral Resources and Mineral Reserves of Merafe Resources (Merafe) in accordance with the requirements of the South African Code for the Reporting of Exploration Results, Mineral Resources and Mineral Reserves (The SAMREC Code) 2016 Edition. All Merafe’s operations are part of a pooling and sharing venture with Glencore Operations South Africa Proprietary Limited (the Glencore-Merafe Chrome Venture (the Venture)). Merafe has a 20.5% attributable beneficial interest in the Mineral Resources and Mineral Reserves of the Venture. The estimates in this document are as at 31 December 2025. To state the Mineral Resources and Mineral Reserves estimates for 31 December 2025, the budgeted production for July 2025 to December 2025 has been subtracted from the total estimates. The Mineral Resources and Mineral Reserves information in the tables on the following pages is based on information compiled by a Competent Person (as defined by The SAMREC Code).
The Venture has chrome mining operations along the Western and Eastern Limbs of the Bushveld Complex. The operations along the Western Limb of the Bushveld Complex comprise the Kroondal mine. The LG6 Package at Kroondal Mine is mined underground using trackless mining methods on a Bord-and- Pillar lay-out. Kroondal will be targeting a production rate of 146ktpm for 2025. Townlands Extension 9 is an exploration project. The status quo has remained the same since the application for a retention permit in November 2017. The DMR accepted the application and the Venture is still awaiting the granting and execution of the application. No exploration costs have to be expended on the project from the date of execution of the application for the subsequent three years. Pending the outcome of the application, no 3rd party may legally apply for a Prospecting Right over this property. Thorncliffe, Magareng and Helena mines are situated along the southern portion of the Eastern Limb of the Bushveld Complex. The MG1 and MG2 Chromitite Layer is being mined underground using trackless mining methods on a Bord-and-Pillar mining lay-out. Thorncliffe, Magareng and Helena mines are situated within the same Mining Right area but are situated on different farm properties. The farms of St George and Richmond have been incorporated into the Mining Right of the Eastern Chrome Mines Complex. The Venture’s silica deposit lies 15km west of Rustenburg. The quartzite is mined mainly to supply the Venture’s furnaces with silica.
The annual Mineral Resources and Mineral Reserves estimates are compared with the previous year’s statement and reconciled each year after the estimates have been finalised. Changes in the year-on-year tonnage and grade estimates are mainly due to mining depletion and changes in the Mineral Resources and Mineral Reserves tonnages and grades due to additional geological information. In addition, disposed or lapsed rights will also impact total Mineral Resources and Mineral Reserves.
The biggest impact to the year-on-year changes in the Mineral Resources tonnages for the Venture is mainly due to resources being upgraded at Waterval/Klipfontein, Thorncliffe and Magareng which constituted a gain of 9.460Mt.
The net movement after mining depletion is a loss of 8.099Mt.
The net change excluding mining depletion is an increase of 5.768Mt. There is a gain at Klipfontein, Richmond and St George is mainly due to resources being upgraded.
There is no material difference in the silica Mineral Resources estimate from December 2024 to December 2025 and the change is mostly attributed to mining depletion. No Mineral Reserves declared for Rietvly as the mine is on care and maintenance.
There are no foreseen material risk factors that could affect the validity of the current Mineral Resources and Mineral Reserves statement. All the legislative requirements have been met with respect to the rights to mining and prospecting for which the Mineral Resources and Mineral Reserves have been reported. All the operating mines are mining under the new order, executed mining rights. The prospecting Rights of all the prospecting areas have been converted to new order prospecting rights.
| Measured
Mineral Resources |
Indicated
Mineral Resources |
Measured and
Indicated Resources |
Inferred
Mineral Resources |
||||||||||
| Name of operation |
Attributable portion |
Mining method |
Commodity | 31 Dec 25 | 31 Dec 24 | 31 Dec 25 | 31 Dec 24 | 31 Dec 25 | 31 Dec 24 | 31 Dec 25 | 31 Dec 24 | Competent Person |
|
| Western chrome mines – LG6 Chromitite Package and MG1 Chromitite Layer | |||||||||||||
| Waterval | 20.5% | UG | Ore (Mt) | 16.231 | 16.231 | 1.03 | 1.03 | 17.257 | 17.257 | 0.675 | 0.7 | MM/DR | |
| Cr2O3 (%) | 41.31 | 41.31 | 42.59 | 42.59 | 41.4 | 41.4 | 43 | 43 | |||||
| Marikana West | 20.5% | UG | Ore (Mt) | 2.974 | 2.974 | 1.69 | 1.69 | 4.67 | 4.67 | MM/DR | |||
| Cr2O3 (%) | 42.43 | 42.43 | 42.60 | 42.60 | 42.5 | 42.5 | |||||||
| Kroondal | 20.5% | UG/OC | Ore (Mt) | 9.199 | 9.166 | 0.27 | 0.53 | 9.465 | 9.696 | MM/DR | |||
| Cr2O3 (%) | 42.69 | 42.70 | 41.47 | 41.47 | 42.7 | 42.6 | |||||||
| Kroondal Gemini | 20.5% | UG/OC | Ore (Mt) | 10.293 | 10.784 | 0.29 | 0.39 | 10.580 | 11.18 | MM/DR | |||
| Cr2O3 (%) | 42.24 | 42.16 | 41.12 | 41.04 | 42.2 | 42.1 | |||||||
| Marikana East | 20.5% | UG | Ore (Mt) |
4.684 | 4.208 |
0.35 | 0.53 |
5.031 | 4.73 |
MM/DR | |||
| Cr2O3 (%) | 42.20 | 42.24 | 41.77 | 41.81 | 42.2 | 42.2 | |||||||
| Klipfontein/ Waterval | 20.5% | UG | Ore (Mt) | 21.095 | 19.980 | 24.15 | 25.15 | 45.246 | 45.13 | 95.001 | 92.0 | MM/DR | |
| Cr2O3 (%) | 41.98 | 41.98 | 41.99 | 41.92 | 42.0 | 41.9 | 42 | 42 | |||||
| Townlands Ext 9 | 20.5% | UG | Ore (Mt) | – | – | 12.94 | 12.94 | 12.945 | 12.945 | MM/DR | |||
| Cr2O3 (%) | – | – | 41.39 | 41.39 | 41.39 | 41.39 | |||||||
| Total – LG6 | Ore (Mt) | 64.475 | 63.343 | 40.71 | 42.26 | 105.19 | 105.60 | 95.7 | 92.6 | ||||
| Cr2O3 (%) | 41.99 | 41.98 | 41.8 | 41.8 | 41.9 | 41.9 | 42 | 42 | |||||
| Western chrome mines – Tailings | |||||||||||||
| Kroondal Dam | 20.5% | Tailings | (Mt) | – | – | – | 2.19 | 2.14 | MM | ||||
| Cr2O3 (%) | – | – | – | 17.7 | 17.9 | ||||||||
| Cashan Dam | 20.5% | Tailings | (Mt) | – | – | – | 0.04 | 0.04 | MM | ||||
| Cr2O3 (%) | – | – | – | 16.9 | 16.9 | ||||||||
| Total Tailings | (Mt) | – | – | – | 2.19 | 2.18 | |||||||
| Cr2O3 (%) | – | – | – | 17.7 | 17.9 | ||||||||
| Bushveld Complex –
Eastern Limb Eastern chrome mines – MG1 Chromitite Layer |
|||||||||||||
| Thorncliffe | 20.5% | UG/OC | Ore (Mt) | 35.413 | 36.305 | 2.65 | 3.08 | 38.066 | 39.380 | – | – | LUN/DR | |
| Cr2O3 (%) | 40.42 | 40.46 | 40.8 | 40.8 | 40.4 | 40.5 | – | – | |||||
| Helena | 20.5% | UG/OC | Ore (Mt) |
20.940 |
21.292 |
11.36 |
11.36 |
32.296 |
32.647 |
8.262 |
8.262 |
LUN/DR | |
| Cr2O3 (%) | 39.97 | 39.95 | 38.6 | 38.6 | 39.5 | 39.5 | 38 | 38 | |||||
| De Grooteboom | 20.5% | UG/OC | Ore (Mt) | 1.038 | 1.038 | 0.50 | 0.50 | 1.543 | 1.543 | – | LUN/DR | ||
| Cr2O3 (%) | 40.22 | 40.22 | 40.3 | 40.3 | 40.2 | 40.2 | – | ||||||
| Richmond | 20.5% | UG | Ore (Mt) | 8.663 | 7.155 | 20.71 | 18.44 | 29.373 | 25.591 | 18.700 | 23.976 | LUN/DR | |
| Cr2O3 (%) | 40.56 | 40.66 | 40.9 | 41.0 | 40.8 | 40.9 | 41 | 41 | |||||
| St George | 20.5% | UG | Ore (Mt) | 0.234 | 0.613 | 4.07 | 4.64 | 4.307 | 5.256 | 13.034 | 13.038 | LUN/DR | |
| Cr2O3 (%) | 39.54 | 40.40 | 39.0 | 40.4 | 39.0 | 40.4 | 39 | 39 | |||||
| Total – MG1 | Ore (Mt) | 66.288 | 66.402 | 39.30 | 38.02 | 105.58 | 104.42 | 40.0 | 45.3 | ||||
| Cr2O3 (%) | 40.29 | 40.31 | 40.0 | 40.2 | 40.2 | 40.3 | 40 | 40 | |||||
| Eastern chrome mines – MG2 Chromitite Layer | |||||||||||||
| Thorncliffe | 20.5% | UG/OC | Ore (Mt) | 0.201 | – | 15.73 | 16.63 | 16.627 | 16.627 | 35.1 | 33.3 | LUN/DR | |
| Cr2O3 (%) | 35.74 | – | 35.1 | 35.1 | 35.1 | 35.1 | 35.9 | 36 | |||||
| Helena | 20.5% | UG/OC | Ore (Mt) | – | – | – | – | – | – | 52.5 | 49.19 | LUN/DR | |
| Cr2O3 (%) | – | – | – | – | – | – | 40.0 | 40 | |||||
| Richmond | 20.5% | UG | Ore (Mt) | – | – | – | – | – | – | 29.1 | 30.4 | LUN/DR | |
| Cr2O3 (%) | – | – | – | – | – | – | 35.6 | 36 | |||||
| St George | 20.5% | UG | Ore (Mt) | – | – | – | – | – | – | 16.6 | 17.07 | LUN/DR | |
| Cr2O3 (%) | – | – | – | – | – | – | 36.8 | 39 | |||||
| Total – MG2 | Ore (Mt) | – | – | 15.73 | 16.6 | 16.6 | 16.6 | 133 | 130 | ||||
| Cr2O3 (%) | – | – | 35 | 35 | 35 | 35 | 37.5 | 38 | |||||
| Total – MG1 & MG2 | Ore (Mt) | 66.490 | 66.402 | 55.02 | 54.64 | 121.51 | 121.04 | 173.4 | 175.3 | ||||
| Cr2O3 (%) | 40.28 | 40.31 | 38.6 | 38.6 | 39.5 | 39.5 | 38 | 38 | |||||
| Eastern chrome mines – Tailings | |||||||||||||
| Thorncliffe Dam | 20.5% | Tailings | (Mt) | – | – | – | – | – | – | 6.00 | 5.21 | SYV | |
| Cr2O3 (%) | – | – | – | – | – | – | 19.3 | 19.2 | |||||
| Helena Paste | 20.5% | Tailings | (Mt) | – | – | – | – | – | – | SYV | |||
| Cr2O3 (%) | – | – | – | – | – | ||||||||
| Total Tailings | 20.5% | Tailings | (Mt) | – | – | – | – | – | – | 6.00 | 5.21 | ||
| Cr2O3 (%) | – | – | – | – | – | – | 19.3 | 19.2 | |||||
Notes:
Tonnages are quoted as million metric dry tonnes.
Grades are quoted as %Cr2O3.
The measured and indicated Mineral Resources are inclusive of those Mineral Resources modified to produce Mineral Reserves.
No cut-off grades are applied to the chromitite layers currently being mined because of the exceptional regional grade consistency and continuity.
The Mineral Resources are estimated as chromitite tonnages and grades to reflect the grades of the various individual chromitite layers.
Both the LG6 and MG1 chromitite layers, which the Venture is currently mining, are discrete solid chromitite layers.
Merafe and Glencore have entered into an agreement for the treatment of current and historical tails at the Western and Eastern operations for the extraction of PGMs. PGM values of the historic tails are not available, as when deposition occurred no analysis on PGM grades was required. The current tailings have been analysed over the last 4 years and are averaging a PGM 4E grade of 5.27 g/t in the East and 3.1g/t in the West.
Competent Persons:
SYV – Sulayman Yousuf Vaid, Glencore Operations SA, (South African Geomatics Council (SAGC) – MS 0114). Lead Competent Person responsible for Mineral Resources and Mineral Reserves.
MM – Mogomotsi Maputle, Glencore Operations SA, Western Chrome Mines, (SACNASP – 400071/14). Responsible for Mineral Resources and Mineral Reserves.
LUN – Lindiwe Unity Nkambule, Glencore Operations SA, Eastern Chrome Mines, (SACNASP – 121635). Responsible for Mineral Resources and Mineral Reserves.
DR –Dean Richards, Obsidian Consulting Services (SACNASP – 400190/08). Responsible for geostatistical analysis of data, Mineral Resource classification and construction of tonnage and grade block models and reporting of tonnage and grades from block models.
| Proved Ore Reserves |
Probable Ore Reserves |
Total Ore Reserves |
Competent Person |
||||||||
| Name of operation | Attributable portion |
Mining method |
Commodity | 31 Dec 25 | 31 Dec 24 | 31 Dec 25 | 31 Dec 24 | 31 Dec 25 | 31 Dec 24 | ||
| Western chrome mines – LG6 Chromitite Package Chromitite Layer | |||||||||||
| Waterval | 20.5% | UG | Ore (Mt) | – | – | – | – | – | – | MM/DR | |
| Cr2O3 (%) | – | – | – | – | – | – | |||||
| Marikana West | 20.5% | UG | Ore (Mt) | – | – | – | – | – | – | MM/DR | |
| Cr2O3 (%) | – | – | – | – | – | – | |||||
| Kroondal | 20.5% | UG/OC | Ore (Mt) | 1.984 | 2.119 | 0.244 | 0.510 | 2.23 | 2.63 | MM/DR | |
| Cr2O3 (%) | 28.41 | 28.64 | 28.4 | 27.8 | 28.4 | 28.5 | |||||
| Kroondal Gemini | 20.5% | UG/OC | Ore (Mt) | 3.683 | 4.469 | 0.226 | 0.308 | 3.91 | 4.78 | MM/DR | |
| Cr2O3 (%) | 31.55 | 30.99 | 30.3 | 30.3 | 31.5 | 30.9 | |||||
| Marikana East | Ore (Mt) | – | – | – | – | MM/DR | |||||
| 20.5% | UG | Cr2O3 (%) | – | – | – | – | |||||
| Klipfontein/Waterval | 20.5% | UG | Ore (Mt) | 3.932 | 2.338 | 0.479 | 0.613 | 4.41 | 2.95 | MM/DR | |
| Cr2O3 (%) | 30.06 | 29.60 | 28.2 | 28.7 | 29.9 | 29.4 | |||||
| Total-LG6 | Ore (Mt) | 9.599 | 8.926 | 0.95 | 1.43 | 10.55 | 10.36 | ||||
| Cr2O3 (%) | 30.29 | 30.07 | 28.7 | 28.7 | 30.2 | 29.9 | |||||
| Bushveld Complex – Eastern Limb | |||||||||||
| Eastern chrome mines – MG1 Chromitite Layer | |||||||||||
| Thorncliffe | 79.5% | UG/OC | Ore (Mt) | 12.010 | 13.370 | 1.85 | 2.13 | 13.86 | 15.50 | LUN/DR | |
| Cr2O3 (%) | 35.17 | 35.20 | 34.1 | 34.3 | 35.0 | 35.1 | |||||
| Helena | 79.5% | UG/OC | Ore (Mt) | 0.939 | 1.308 | 0.94 | 1.31 | LUN/DR | |||
| Cr2O3 (%) | 29.06 | 29.65 | 29.1 | 29.6 | |||||||
| Richmond | 79.5% | UG/OC | Ore (Mt) | 5.055 | 4.326 | 4.57 | 4.27 | 9.62 | 8.59 | LUN/DR | |
| Cr2O3 (%) | 32.60 | 38.33 | 33.5 | 33.4 | 33.0 | 35.9 | |||||
| St George | 79.5% | UG/OC | Ore (Mt) | 0.426 | – | 0.53 | – | 0.95 | – | LUN/DR | |
| Cr2O3 (%) | 28.27 | – | 28.3 | – | 28.3 | – | |||||
| Total – MG1 | Ore (Mt) | 18.431 | 19.004 | 6.94 | 6.39 | 25.38 | 25.40 | ||||
| Cr2O3 (%) | 33.99 | 35.53 | 33.2 | 33.7 | 33.8 | 35.1 | |||||
| Eastern chrome mines – MG2 Chromitite Layer | |||||||||||
| Thorncliffe | 79.5% | UG/OC | Ore (Mt) | 1.11 | 2.37 | 1.11 | 2.37 | LUN | |||
| Cr2O3 (%) | 25.5 | 26.1 | 25.5 | 26.1 | |||||||
| Total – MG1 and MG2 | Ore (Mt) | 18.431 | 19.004 | 8.05 | 8.76 | 26.48 | 27.76 | ||||
| Cr2O3 (%) | 34.0 | 35.5 | 32.2 | 31.7 | 33.4 | 34.3 | |||||
Notes:
Tonnages are quoted as million metric dry tonnes.
Grades are quoted as %Cr2O3.
No cut-off grades are applied to the chromitite layers currently being mined due to the exceptional regional grade consistency and continuity. A minimum mining cut of 1.8m is applied to the ore reserve tonnage to accommodate the mechanised mining equipment employed by the underground mining operations. External waste is included to make up the minimum cut where applicable.
The chromitite layers are mined mainly underground using trackless mechanised mining methods on a Bord-and-Pillar mine lay-out design.
Competent Persons:
SYV – Sulayman Yousuf Vaid, Glencore Operations SA, (SAGC – GT g MS 0114). Lead Competent Person responsible for Mineral Resources and Mineral Reserves.
MM – Mogomotsi Maputle, Glencore Operations SA, Western Chrome Mines, (SACNASP – 400071/14). Responsible for Mineral Resources and Mineral Reserves.
LUN – Lindiwe Unity Nkambule, Glencore Operations SA, Eastern Chrome Mines, (SACNASP – 121635). Responsible for Mineral Resources and Mineral Reserves.
This summary has been reviewed and the relevant data extracted and compiled by Sulayman Yousuf Vaid (SYV). SYV is the Lead Competent Person, registered with the South African Geomatics Council (SAGC, P.O Box 752799, Garden View, 2047), Reg. No. -GT gMS 0114 and holds a National Diploma in Mine Surveying. SYV is a Mine Surveyor with 32 years’ experience in Mine Survey, Mine planning and resource and reserve estimations and is directly linked to the mining industry and currently a full-time employee of Glencore Operations South Africa. SYV consents to the inclusion in this report of the matters based on this information in the form and context in which it appears.
Sulayman Yousuf Vaid
Glencore Operations South Africa Proprietary Limited
PO Box 2131
Rustenburg
0300
RSA
Tel: (014) 590 2415
Fax: (014) 590 2498

